






Market Size and Market Growth Are Different Signals
New state-level estimates from the National Association of Home Builders show why a national remodeling headline is not enough for millwork planning.
In the first quarter of 2026, California represented an estimated 8.0% of U.S. remodeling activity, followed by Texas at 7.3% and Florida at 5.5%. Together, those three states accounted for 20.8% of the market. New York ranked fourth at 4.0%, and North Carolina ranked fifth at 3.0%. NAHB State Projections of Remodeling, August 10, 2026
The states posting the largest dollar increases were different: Michigan, Virginia, North Carolina, Alabama and Washington. Michigan led with an estimated $637.6 million increase, or 10.1%, while Alabama recorded an 8.2% gain.
For distributors, scale and momentum answer different questions. A large established market may justify broad availability of high-turn profiles. A faster-growing market may justify additional capacity, but not automatically the same depth or product mix.
Do Not Convert Remodeling Dollars Directly Into Linear Feet
NAHB’s State Projections of Remodeling are model-based estimates. The model starts with national improvement spending and uses several indicators to estimate each state’s market share and spending change. The figures are not a census of remodeling contracts, building permits or moulding purchases.
Dollar volume also includes many projects that use little interior trim, such as roofing, mechanical work or exterior repairs. Conversely, a relatively modest repaint-and-refresh project may replace substantial baseboard or casing.
The data are therefore best used as a market-screening signal. Local point-of-sale history, contractor backlogs, housing type, profile preferences and customer commitments remain closer measures of actual moulding demand.
National Activity Is Positive but Losing Momentum
The state results sit inside a market that is still active but becoming less uniform.
NAHB’s Remodeling Market Index registered 61 in the second quarter of 2026. A reading above 50 means more remodelers described conditions as good than poor. Current conditions remained strong at 70, but the forward-looking indicators averaged only 52 as leads, inquiries and backlogs softened. NAHB Remodeling Market Index, July 9, 2026
The Joint Center for Housing Studies at Harvard separately expects annual owner-occupied improvement and repair spending growth to slow to 0.5% by the second quarter of 2027, with spending projected at $519 billion through mid-2027. Its forecast is national and is not directly comparable with NAHB’s state model, but both sources point toward slower, uneven expansion rather than a broad surge.

Build a Two-Layer Regional Assortment
The practical response is to separate a common core from regional extensions.
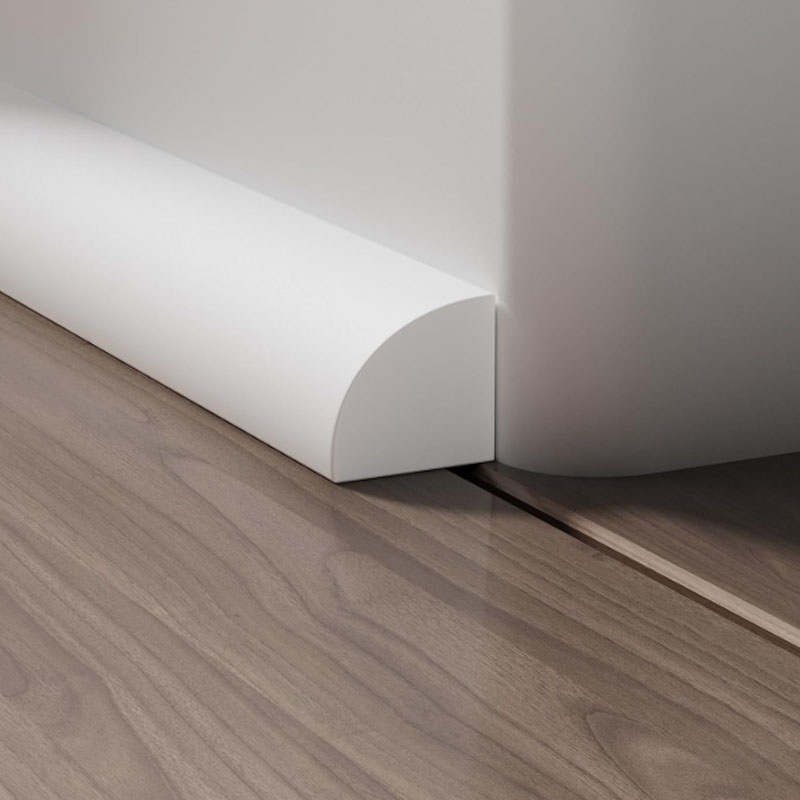
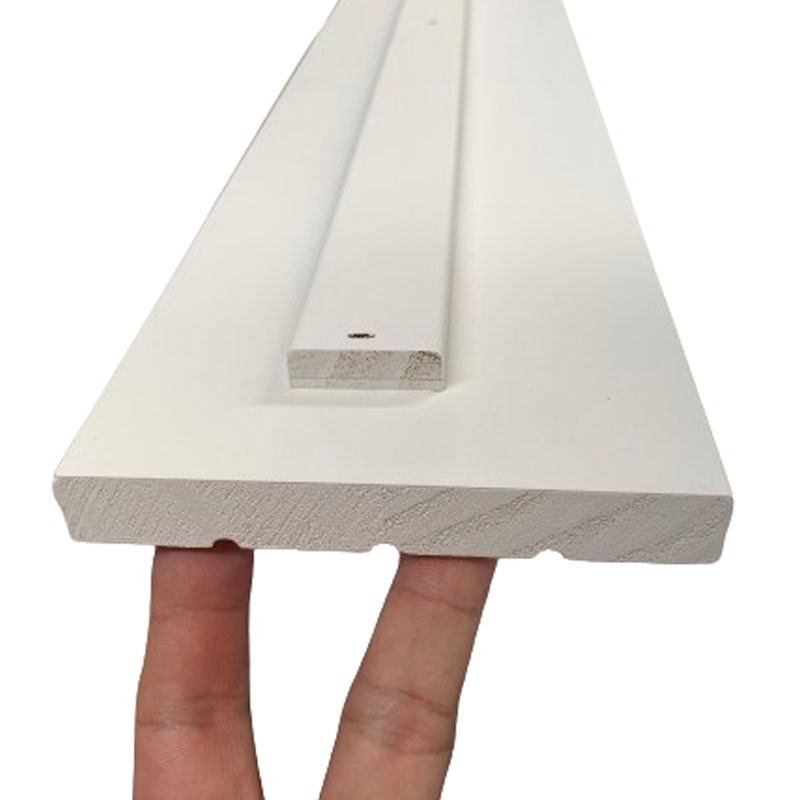
Core inventory can include the baseboard, casing, quarter round, S4S and door-jamb dimensions that turn consistently across several branches. These items can support routine replenishment and stock transfers when packaging and labels use the same SKU definitions.
Regional extensions should follow verified local demand. Profile geometry, width, substrate, length mix and door-jamb configuration can differ by housing stock, builder practice and customer preference. A profile that succeeds in Florida should not be assumed to have the same velocity in Michigan simply because both markets appear strong in different measures.
North Carolina deserves particular attention in the latest release because it appears in both the top five for market share and the top five for dollar growth. That combination may support deeper analysis, but it still does not replace branch-level sell-through.
Use a Regional Replenishment Scorecard
Importers and multi-branch distributors can connect external data to internal decisions through five controls:
Classify each market: Separate high-volume, faster-growth and watch-list states instead of applying one national forecast.
Measure local turns: Track sales, margin, stockouts and aging inventory by branch and SKU.
Protect the core: Maintain availability in proven profiles while setting tighter limits for decorative or project-specific items.
Test before expanding: Use samples, customer commitments or smaller initial allocations before adding regional depth.
Review quarterly: Compare new state indicators with actual orders, backlogs and inventory performance, then change reorder points deliberately.
Plan Regionally, Source Consistently
The latest data show where remodeling dollars are concentrated and where estimated spending is rising, but they do not prescribe a container mix. Buyers gain more value by combining these signals with local customer evidence and disciplined SKU controls.
Reshine Wood Industry supplies primed pine and MDF mouldings and primed pine door-jamb components. We work with importers and distributors on profile drawings, product mixes, packaging and shipment planning so regional assortments can follow their approved specifications and inventory requirements.
